Automatically update R installation
This is best done through RStudio which keeps everything up to date.

This is best done through RStudio which keeps everything up to date.
It is very easy to flip transpose a data frame in R.
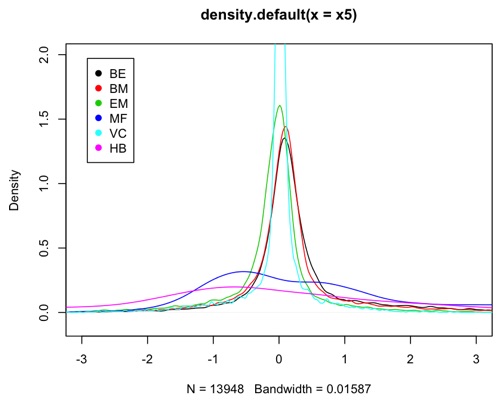
A density plot can be used to compare the distribution of different variables.
Sometimes a package is needed that is not part of the R installation. It is easy to install it, and all its dependencies.
To find out the version of all R packages used, which is useful to refer to in publications
It is easy to produce figures with multiple panels in R.
The antilogit value of a variable can. E useful in plotting.
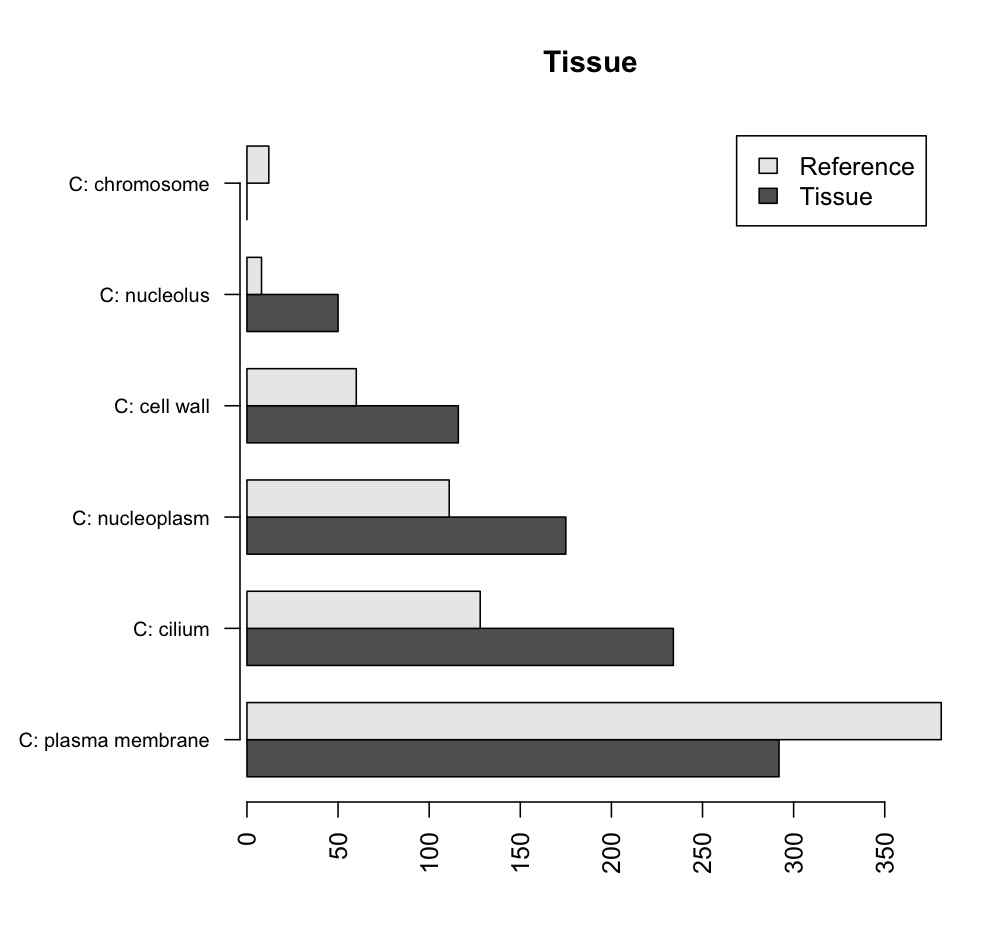
Barplots can be useful for comparing different treatments.
Boxplots allow to easily visualise factor levels within a variable