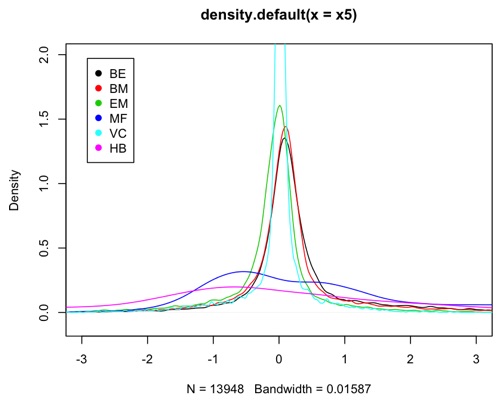
Density plot
A density plot can be used to compare the distribution of different variables.

A density plot can be used to compare the distribution of different variables.
It is easy to produce figures with multiple panels in R.
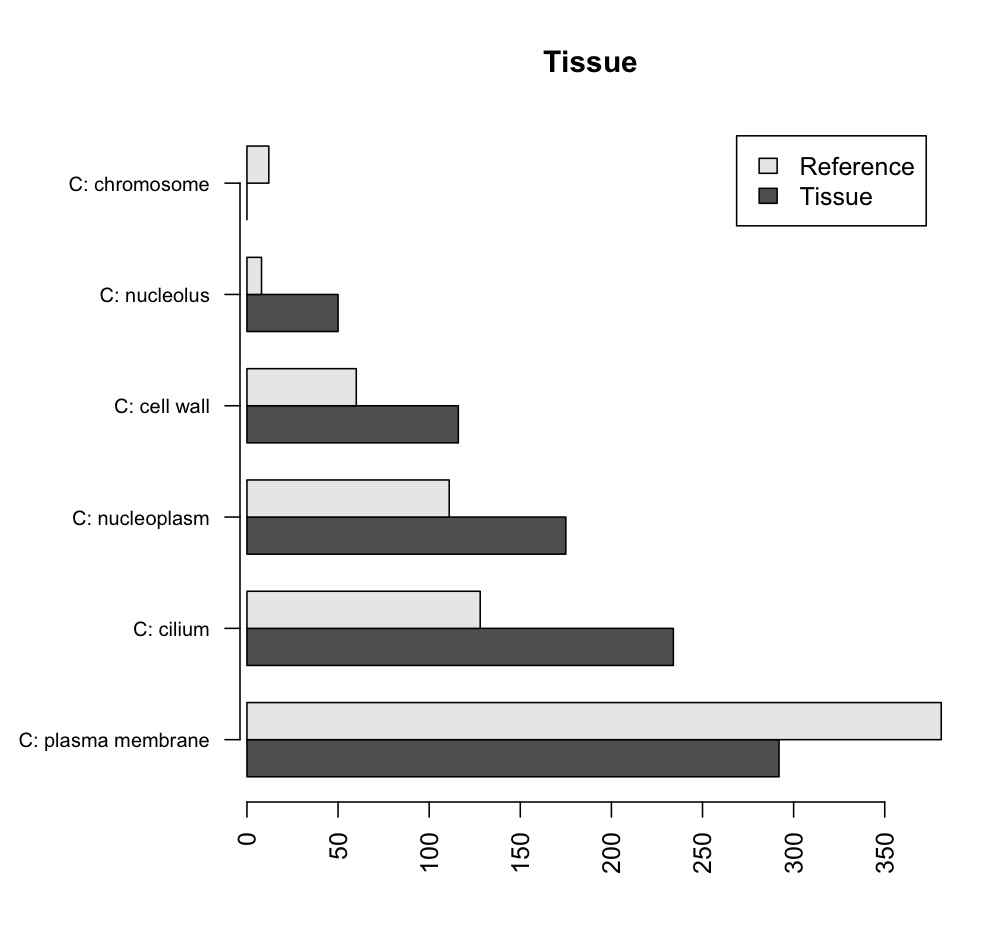
Barplots can be useful for comparing different treatments.
Boxplots allow to easily visualise factor levels within a variable
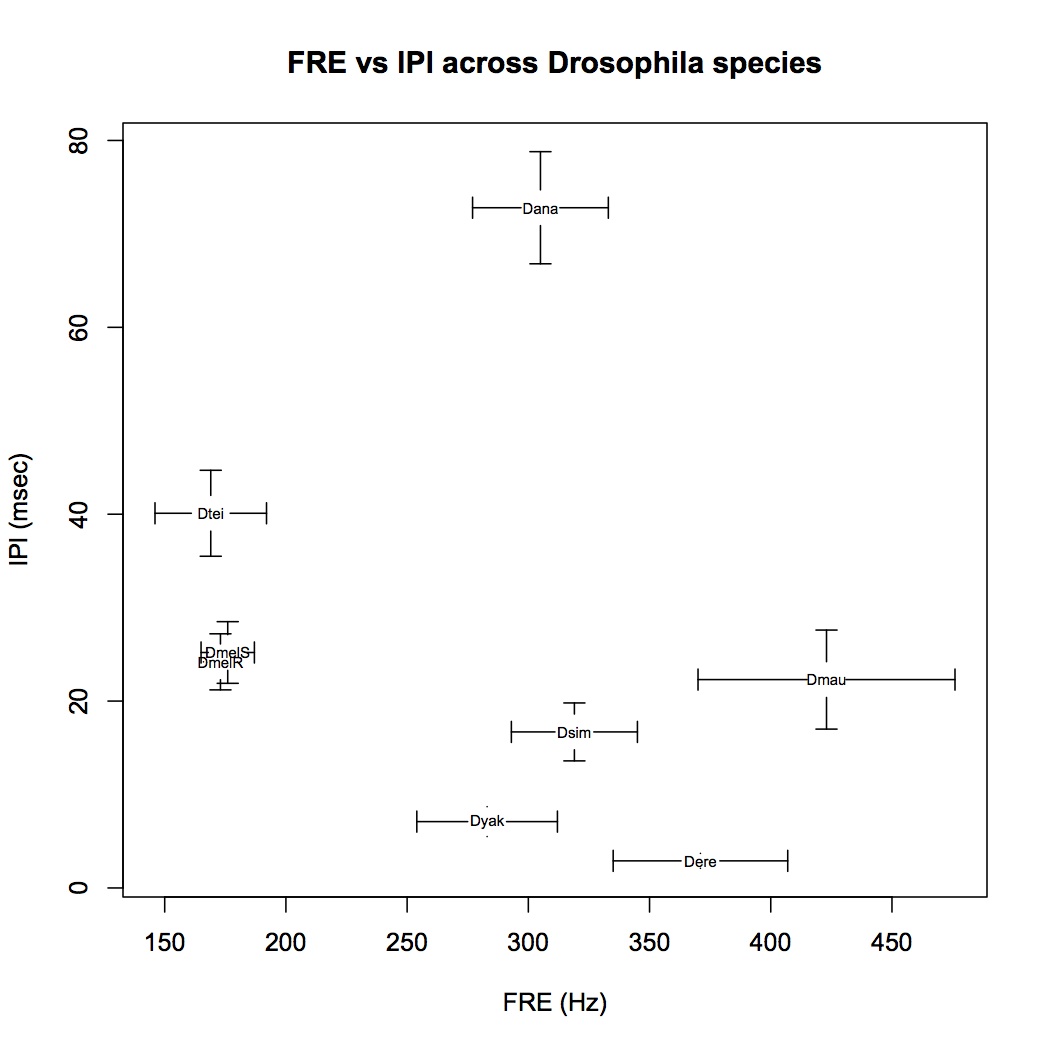
Here is how to plot the values of two traits, along with error bars for these values, to see if they overlap in different instances.
It is useful to save R graphics with code, so the file creation and naming can be automated.
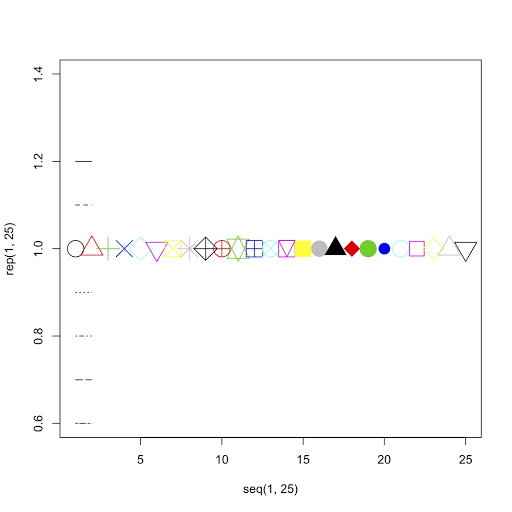
Here is some code to quickly access what the colour, line and shape numbers produce.
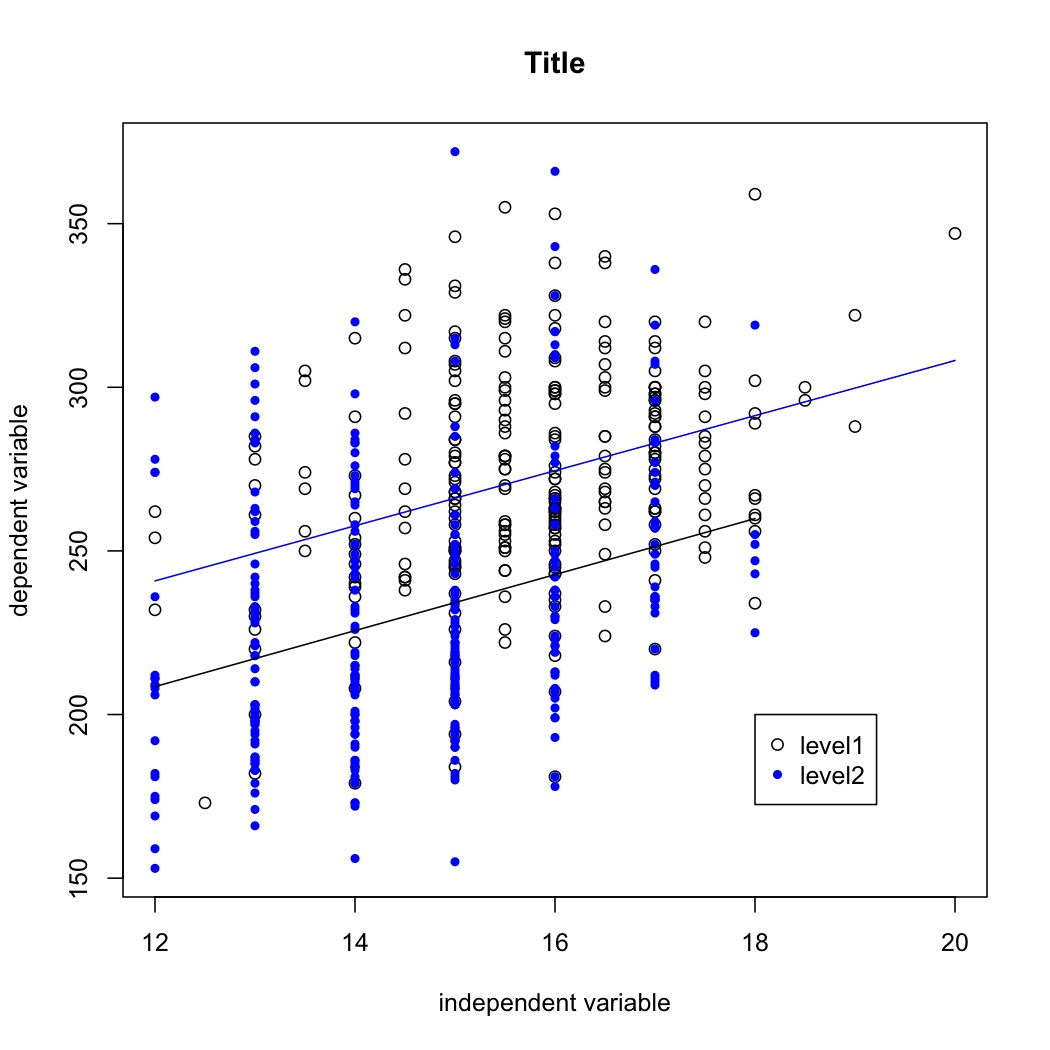
Often a model will show a difference between the two levels of a factor. R makes it easy to illustrate the difference graphically.