Stacks Image 20108

For Academics

Density plot

A density plot can be used to compare the distribution of different variables.

However it does not provide their actual values.

plot( density(x1), xlim=range( c(x1, x2) ))
lines(density(x2), col=2)
rug(x1, col=1, ticksize=0.01, line=2.5)
rug(x2, col=2, ticksize=0.01, line=3.0)

or

rug(jitter(x2), col=2, ticksize=0.01, line=3.0) 
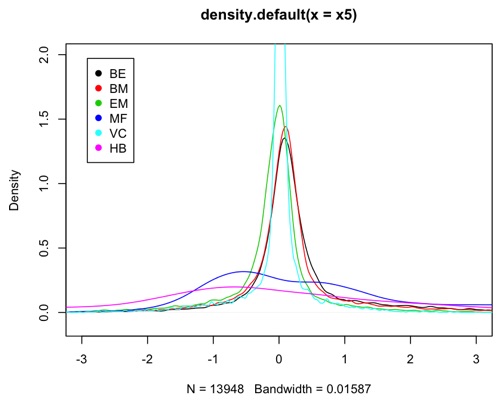
densityplot

Example density plot.
Previous Post 3 / 21 Post

Tag:

Sex chromosome papers RSS


Extreme heterochiasmy and high rates of sex-reversed recombination result in large yet homomorphic sex chromosomes in the Emei moustache toad
Link

The genome sequence of the harbour porpoise, Phocoena phocoena (Linnaeus, 1758)
Link

The genome sequence of a beetle, Pycnomerus fuliginosus Erichson, 1842
Link