Stacks Image 20108

For Academics

Density plot

A density plot can be used to compare the distribution of different variables.

However it does not provide their actual values.

plot( density(x1), xlim=range( c(x1, x2) ))
lines(density(x2), col=2)
rug(x1, col=1, ticksize=0.01, line=2.5)
rug(x2, col=2, ticksize=0.01, line=3.0)

or

rug(jitter(x2), col=2, ticksize=0.01, line=3.0) 

densityplot

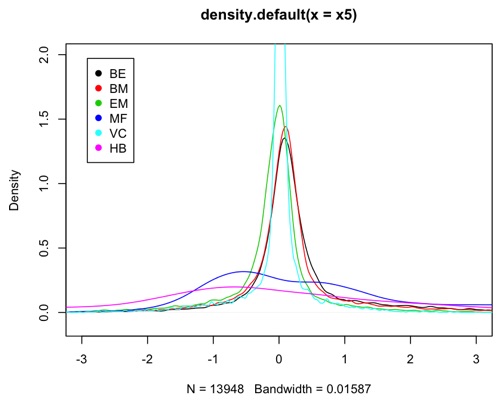
Example density plot.
Post 1 / 8 Post

Tag:

Sex chromosome papers RSS


Recurrent sex chromosome turnover mediated by distinct ARR17 and PISTILLATA duplications in willows
Link

Identification of sex chromosome, sex-biased gene expression and dosage compensation in the pygmy mole cricket Xya riparia (Orthoptera: Tridactyloidea)
Link

XX/XY chimerism in tortoiseshell tomcats - a new case and review of the literature
Link