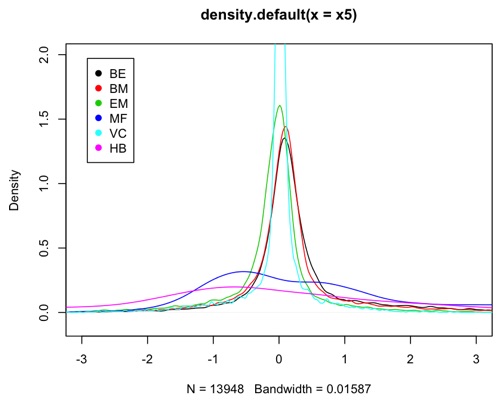
Density plot
A density plot can be used to compare the distribution of different variables.
However it does not provide their actual values.
plot( density(x1), xlim=range( c(x1, x2) ))
lines(density(x2), col=2)
rug(x1, col=1, ticksize=0.01, line=2.5)
rug(x2, col=2, ticksize=0.01, line=3.0)
or
rug(jitter(x2), col=2, ticksize=0.01, line=3.0)

Example density plot.
