Lines
Often a model will show a difference between the two levels of a factor. R makes it easy to illustrate the difference graphically.
Our model is of the type:
mod1 <- (lm(dependent ~ independent(continuous) + independent(factor), data=data.frame.name)
An interaction term could also exist in the model. Example independent variables are temperature(continuous) and sex(factor).
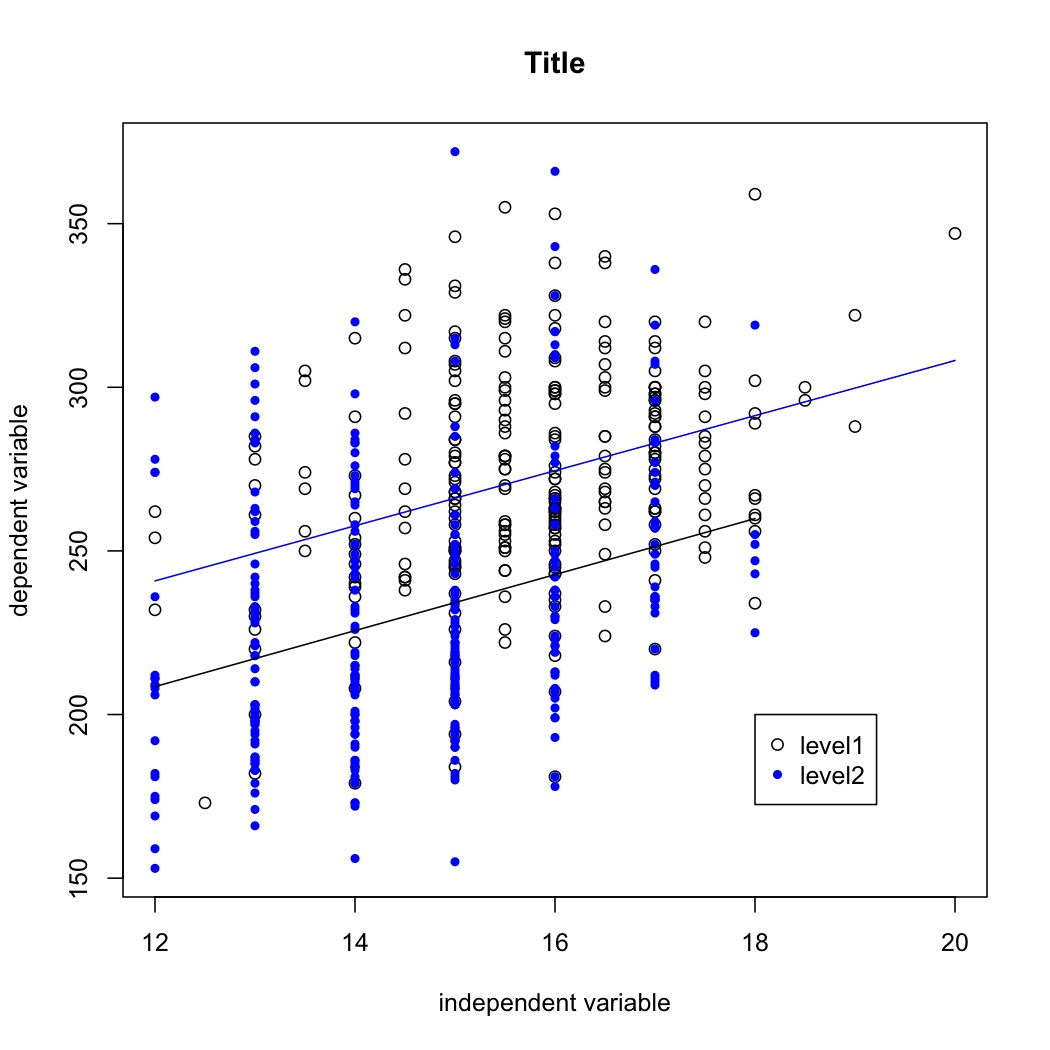
Out final plot will look like this:

If there is an interaction, the lines will not be parallel.
Start by making an empty plot, with title and labels for the axes
plot(data.frame.name$independent, data.frame.name$dependent, type='n', main='Title', xlab='independent variable', ylab='dependent variable')
Add points with a different colour for each of the levels of a factor
points(data.frame.name$independent[data.frame.name$factor=='level1'], data.frame.name$dependent[data.frame.name$factor=='level1'], col=1)
points(data.frame.name$independent[data.frame.name$factor=='level2'], data.frame.name$dependent[data.frame.name$factor=='level2'], col=4, pch=20)
Make a small variable name for the predicted values from the model, for each of the levels.
fittedLevel1<-fitted(mod1)[data.frame.name$factor=='level1']
fittedLevel2<-fitted(mod1)[data.frame.name$factor=='level2']
Plot lines for each of the factor levels. Note that all x values are given first in the input, followed by all the x values
lines(c(min(data.frame.name$independent[data.frame.name$factor=='level2']),max(data.frame.name$independent[data.frame.name$factor=='level2'])), c(min(fittedLevel2),max(fittedLevel2)), col=1)
lines(c(min(data.frame.name$independent[data.frame.name$factor=='level1']),max(data.frame.name$independent[data.frame.name$factor=='level1'])), c(min(fittedLevel1),max(fittedLevel1)), col=4)
Finally, add a legend (the coordinates will depend on your data)
legend(18, 200, legend=c('level1', 'level2'), pch =c(1,20), col=c(1,4))
