
Symbols lines and colours
Here is some code to quickly access what the colour, line and shape numbers produce.
plot(seq(1,25), rep(1,25), pch=seq(1,25), cex=3, col=seq(1,25))
lines(c(1.2, 1.2), lty=1)
lines(c(1.1, 1.1), lty=2)
lines(c(0.9, 0.9), lty=3)
lines(c(0.8, 0.8), lty=4)
lines(c(0.7, 0.7), lty=5)
lines(c(0.6, 0.6), lty=6)
This will produce the following plot:
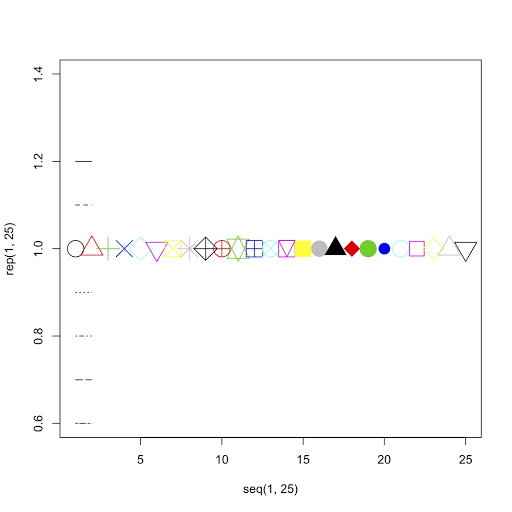
The lines from top to bottom show line types from 1 to 6. The points from left to right show the shapes from 1 to 25. The colour of the points from left to right shows the colour from 1 to 25.
Some colours are not colour-blind friendly.
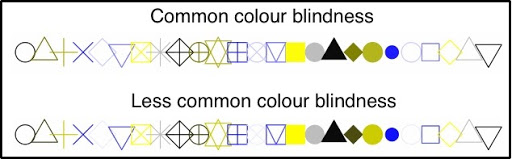
The colours as seen by colour-blind people. Avoid colours that are faint or look similar. Colours 1,2,4,7,8 are easy to distinguish.